Why We Should Still Be Cautious About This SPY Rebound
Posted: 24 April 2025
The SPY chart might look like it’s recovering — but beneath the surface, our quantum-based indicators say: not so fast.

Chart 1: Bloomberg chart of SPY ETF Jan to 24 April 2025 - Candlestick OHLC and Volume
This recent bounce may appear encouraging, but when we apply the Modified Schrödinger Equation (MSE) model — with its seven wave-derived indices — the signals tell a more cautious story.
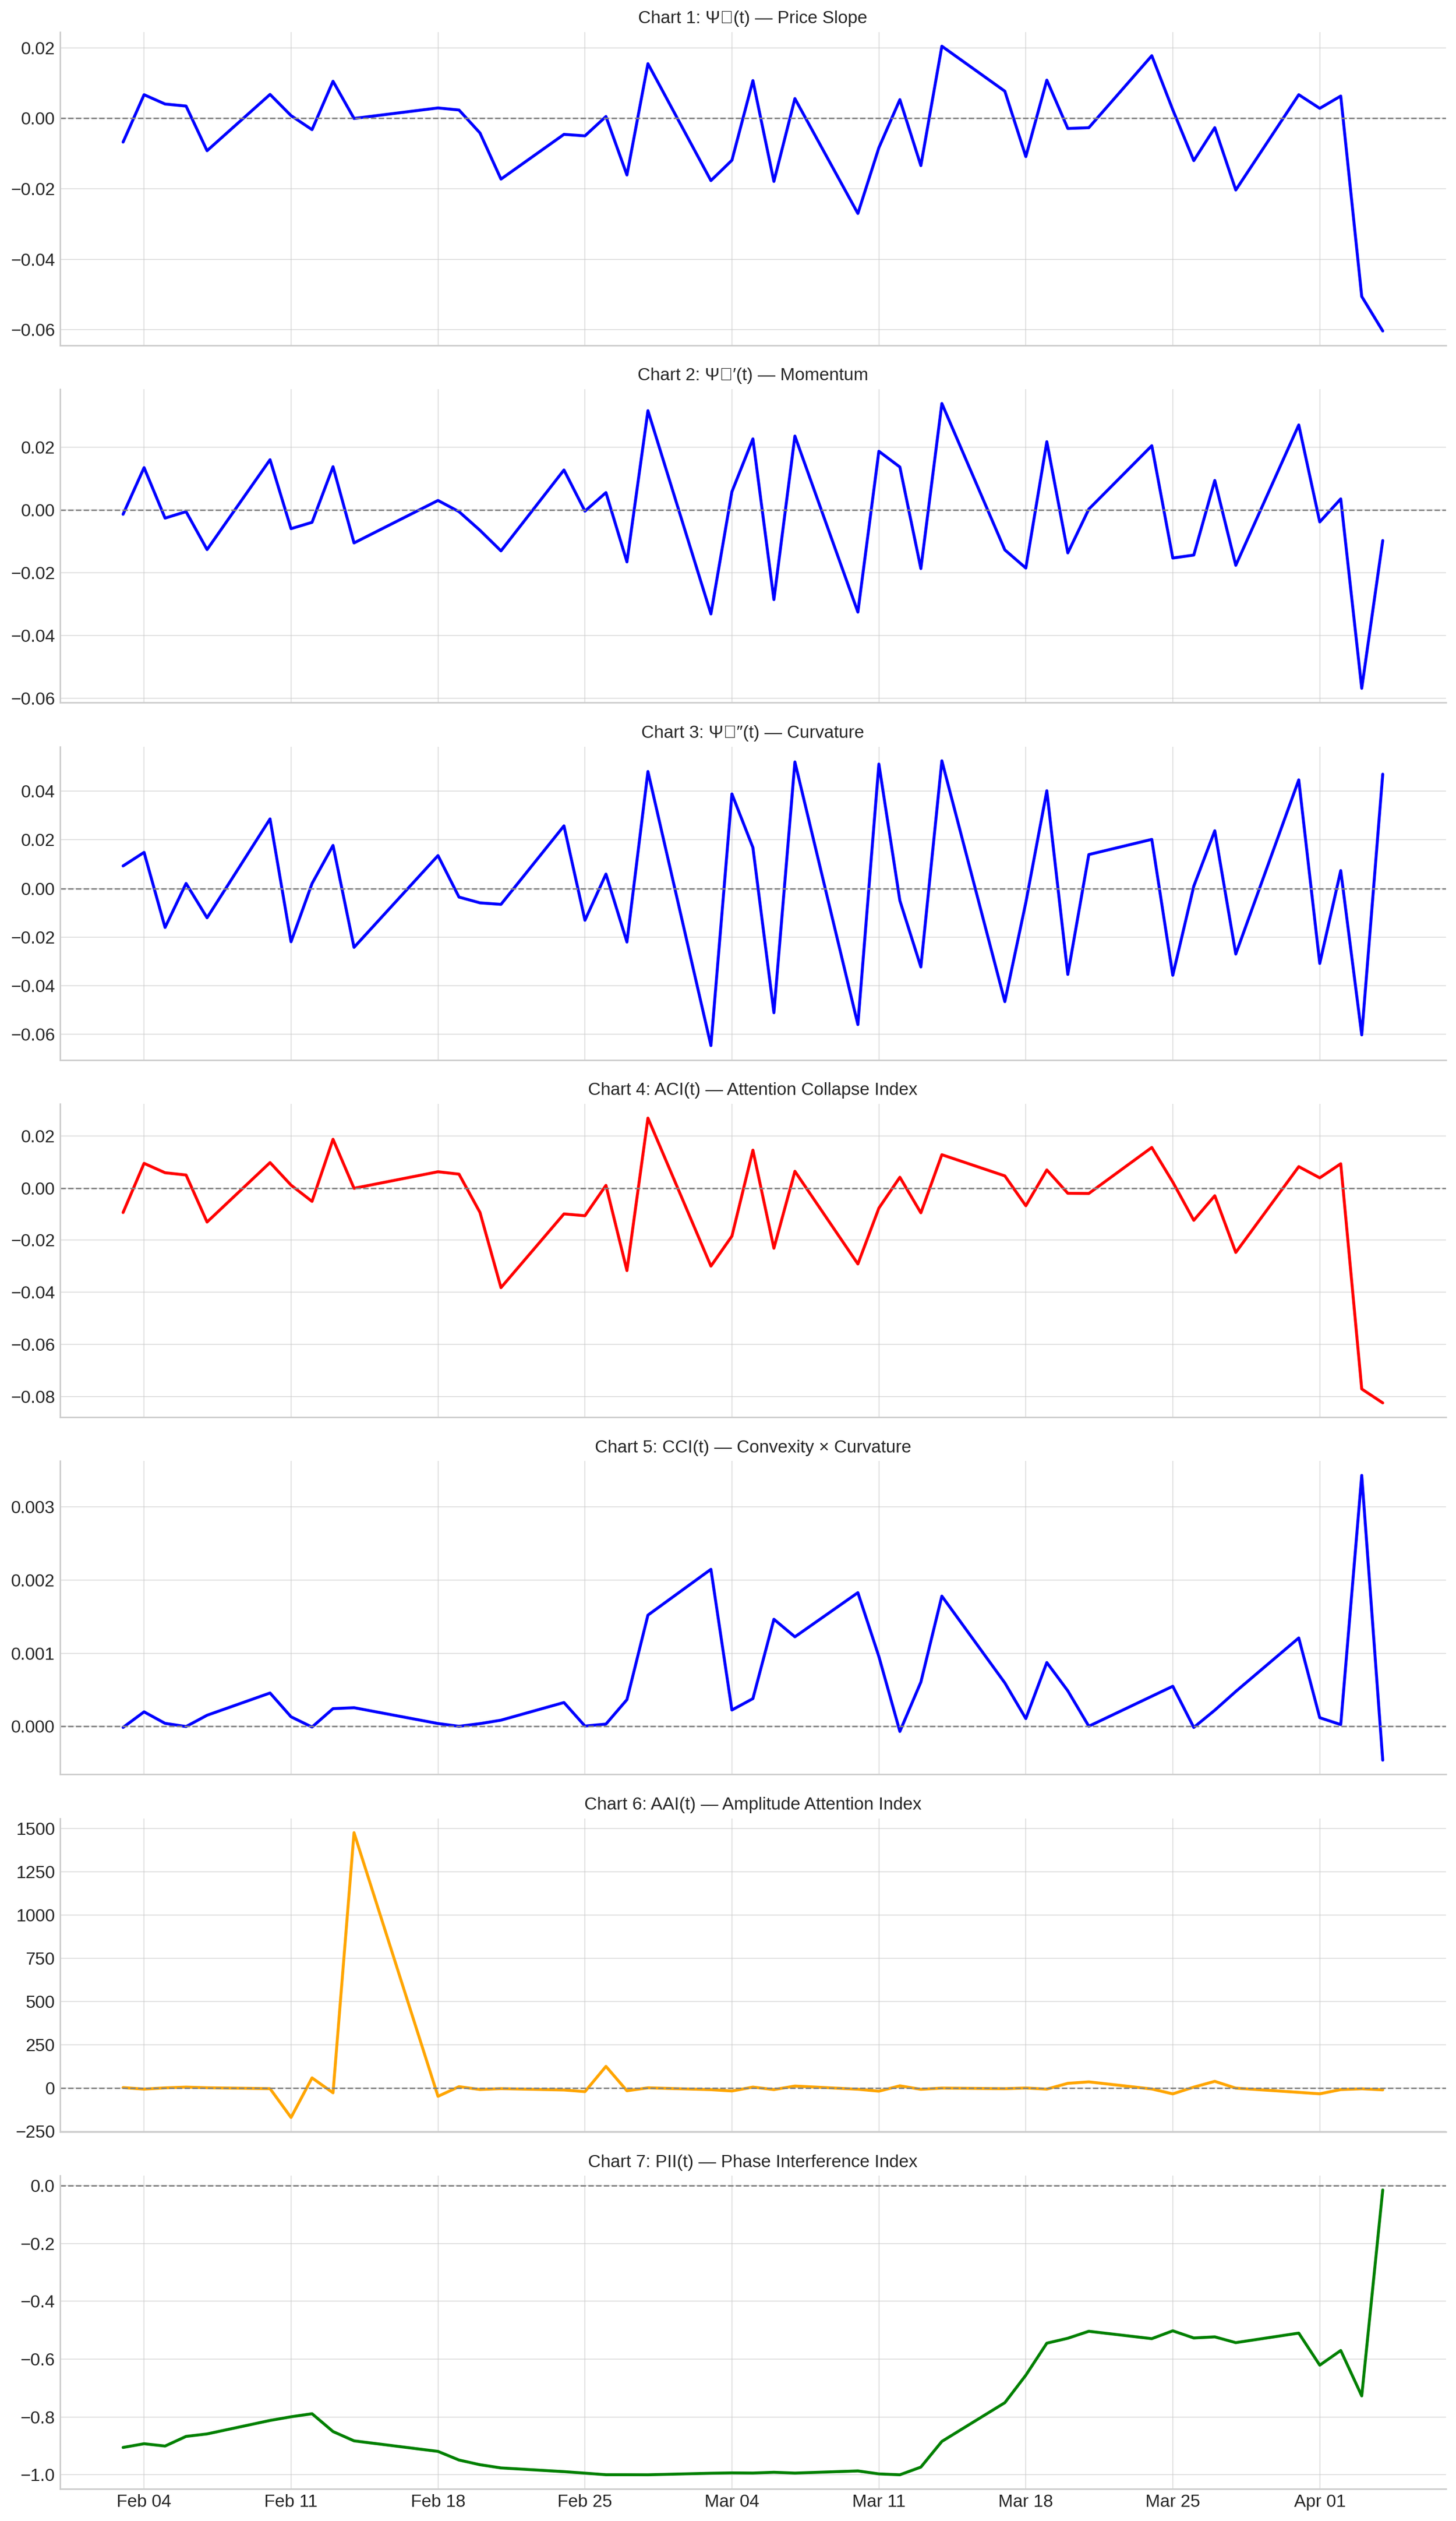
Chart 2 - Modified Schrödinger Equation (MSE) model
What the Quantum Signals Say
ACI(t): Attention Collapse Index
Current reading: −0.08
ACI tells us how emotionally engaged the crowd is. Right now, there’s barely a pulse. For real rallies, we want ACI between +0.05 and +0.20, signalling stable engagement. This looks more like disinterest than conviction.Ψₚ′(t): Momentum and Ψₚ(t): Slope
Current readings: near zero
These need to rise above +0.005 (momentum) and +0.003 (slope) — and sustain — to confirm any strength in the rebound. So far, it’s weak and inconsistent.CCI(t): Convexity × Curvature Index
Current reading: near zero
CCI reflects how much positioning stress is in the system (e.g., funds being forced to adjust). We need +0.0015 or higher before we trust that large players are helping to fuel the rally.PII(t): Phase Interference Index
Current reading: ≈ 0.00
This index tells us whether price and volatility are moving in harmony. A value closer to +0.85 means the market is flowing with clear intention. Right now, it shows confusion, not coordination.Ψₚ″(t): Curvature
Curvature spiked earlier, showing the worst of the stress may be over. But on its own, that’s not enough — we need other indices to confirm a true recovery.AAI(t): Amplitude Attention Index
Currently calm — no volatility surges, which is good — but this only helps if other indices are turning up, which they’re not.
Bottom Line: Watch the Waves Before You Ride Them
Although SPY’s price looks like it’s bouncing, this could simply be a dead-cat bounce or mechanical rebalancing, not a genuine shift in investor conviction. The deeper “quantum wave” structure behind the market is not yet aligned.
Until we see:
ACI(t) between +0.05 to +0.20,
Momentum > +0.005,
Slope > +0.003,
CCI > +0.0015, and
PII rising toward +0.85,
…it’s better to stay on the sidelines.
We don’t just follow charts — we follow waves. And right now, the interference patterns say: Not yet.
Footnote: Claremont Partners is a licensed Bloomberg user