Patience Over Panic: Let the Data Decide
The summer of 2025 has delivered a volatile mix of market-moving events, from tariff hikes and sticky inflation to modest job gains and a cautious Fed. As the chart shows, positive developments like record stock highs and a U.S.–China trade truce have been offset by negative shocks such as higher producer prices, tariff hikes, and a stock selloff. Many data points remain neutral, but the sequence reveals a market caught between opposing forces. This balance of risks underscores why the Fed should hold steady for now—waiting until the effects of tariffs fade and inflation shows clearer signs of easing.
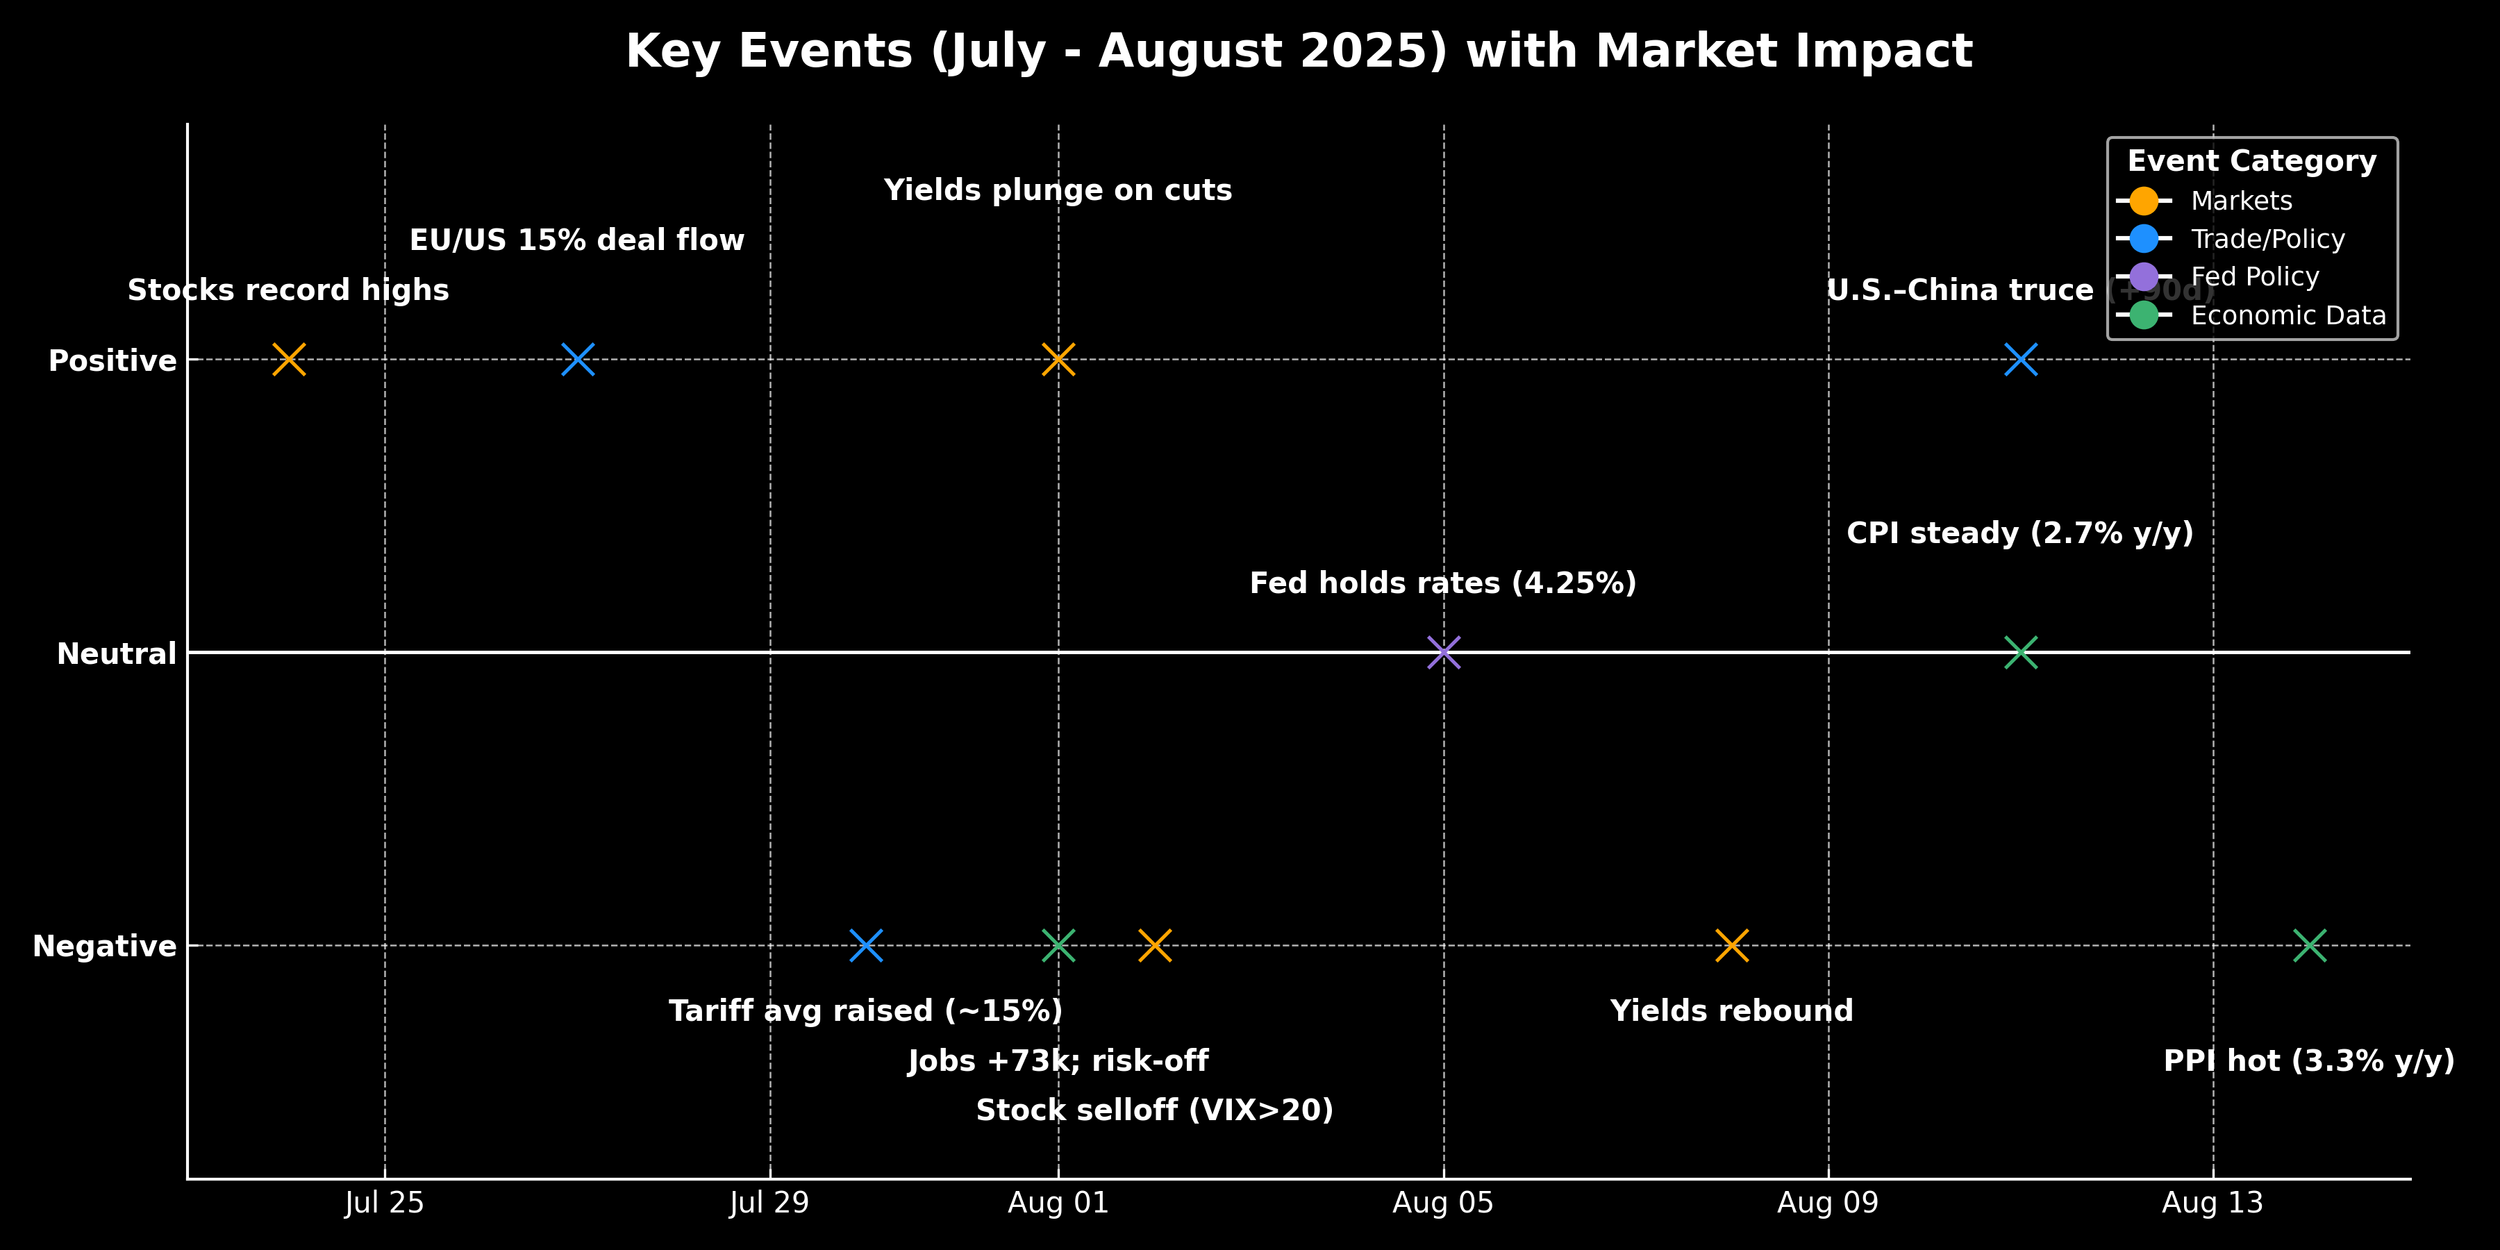
Positive and negative market drivers in July–August 2025 show why September rate cuts could reignite inflation—patience still looks like the safer course.
Why the Fed Should Wait: The Hidden Risks Behind September Rate Cuts
Tariffs, inflation, and labor data tell a more complicated story than headline numbers suggest. The market impact chart below shows that recent events have not been uniformly positive or negative—rather, the past six weeks have been a tug-of-war between supportive and destabilizing forces.
Steady CPI Isn’t a Green Light for Cuts
July CPI held at 2.7% year-on-year—a neutral reading in the broader picture—but the July Producer Price Index (PPI) rose 3.3%, a clear negative signal likely driven by tariff pass-through costs. Services and shelter inflation remain sticky, suggesting price pressures are still entrenched. The chart shows inflation data clustered in the neutral-to-negative range, reinforcing why it’s premature to declare victory over inflation.
Labor Market Weakness Is Emerging
Payroll growth slowed to just +73,000 jobs in July, a negative surprise that landed alongside risk-off sentiment in equities. While unemployment is inching higher, the labor market’s deterioration is not yet deep enough to outweigh inflation concerns. As the chart illustrates, these job figures fall squarely in the “negative” zone, tempering any rush to ease policy.
Tariffs Are Distorting the Data
The late-July tariff hike (~15%)—a clearly negative market driver—was followed by a 90-day truce with China, a positive development. This back-and-forth is visible in the chart: trade policy events straddle both the positive and negative rows. The immediate post-tariff surge in activity, as businesses rush to import before costs rise, creates a misleading burst of momentum that could mask a slowdown later in the year.
Why September Is Too Soon
With rates at 4.25%, the Fed risks stoking inflation expectations if it cuts in September while tariffs are still feeding into prices. The chart makes it clear: the balance of recent events skews toward inflationary or risk-off signals. Waiting until November or December allows time for tariff effects to fade, labor softness to confirm, and core services inflation to ease—conditions that would justify a better-timed cut.
Investor Playbook for the Months Ahead
Equities: Expect short-term pops on trade headlines, but cyclicals remain vulnerable once the tariff-driven surge fades.
Defensives: Healthcare and utilities offer resilience while the macro picture remains mixed.
Bonds: Longer-dated yields could fall when cuts arrive, but inflation stickiness may keep them elevated in the near term.
Commodities: Metals and energy prices remain highly sensitive to the U.S.–China policy track.
Bottom Line
Patience is not just caution—it’s strategy. The new positive/negative impact chart makes it clear: recent developments are a mixed bag, with downside risks still in play. The Fed’s challenge is to look past the noise, let tariff distortions wash out, and cut only when the balance of data shifts decisively toward sustained disinflation.